How Much Can I Afford on a House? 4 Steps to Your Number
By Sohaib Ibrahim · Published October 23, 2026
The quickest way to answer how much can I afford on a house is to cap your total housing payment at 28% of your gross monthly income. Then keep that payment plus your other debts under 36%, and convert the payment into a price using your down payment and interest rate. For a household earning $90,000 a year with $400 in monthly debts, that works out to about a $333,000 home under the assumptions in this guide. A calculator then confirms the math in seconds.
The trouble is that most advice gives you one number and no way to check it. A lender may approve you for far more than you want to pay each month. An income multiple ignores your car loan and student debt. Many online tools bury their assumptions about taxes, insurance, and rates. You end up house hunting at the wrong price point and finding out late.
This guide walks you through the process in four steps: gather your inputs, run the 28/36 rule by hand, check the result in the free Affordability Calculator from HomeLoanCalc.io, and adjust for costs the payment formula misses. You will see worked examples for incomes from $50,000 to $200,000, so you can find your own row and move on.
How lenders decide what you can afford
Lenders judge affordability with two ratios, both measured against your gross monthly income: how much goes to housing, and how much goes to all debt combined. Knowing both ratios explains every calculator result you will see.
The 28/36 rule in plain terms
The 28/36 rule says your housing payment should stay at or below 28% of gross monthly income, and your housing payment plus other monthly debts should stay at or below 36%. Gross means before taxes and deductions. Here is what each ratio counts:
| Ratio | Limit | What it includes |
|---|---|---|
| Housing (front-end) | 28% of gross income | Principal, interest, property taxes, homeowners insurance, PMI, HOA dues |
| Total debt (back-end) | 36% of gross income | Housing payment plus car loans, student loans, and minimum credit card payments |
Lenders often stretch past these numbers. Many approve total debt ratios of 36% to 43%, and some loan programs go higher. FHA loans commonly use 31% and 43%, and VA loans look at about 41% total.
Your price ceiling is whichever limit you hit first, the 28% housing cap or the 36% total-debt cap.
Why approval is not the same as affordable
A lender's maximum is the most you can borrow, not the amount that leaves your life comfortable. Because the ratios use gross income, a payment at 28% takes a larger bite out of your take-home pay. It also leaves no room for groceries, child care, or retirement savings. Treat the lender's figure as a hard ceiling and aim below it.
For a quick sanity check, a common guideline puts the home price at 3 to 5 times your annual household income. The range is wide because it ignores debt, down payment, and rates. Use it to catch obvious errors, not to set your budget. The ratios above do the real work.
Step 1. Gather your income, debts, and cash
Collect five numbers before you open any calculator: gross monthly income, monthly debt payments, down payment, credit score range, and an interest rate assumption. Entering rough guesses is the most common reason people get a result they cannot use.
List the five inputs
Write these down in this order:
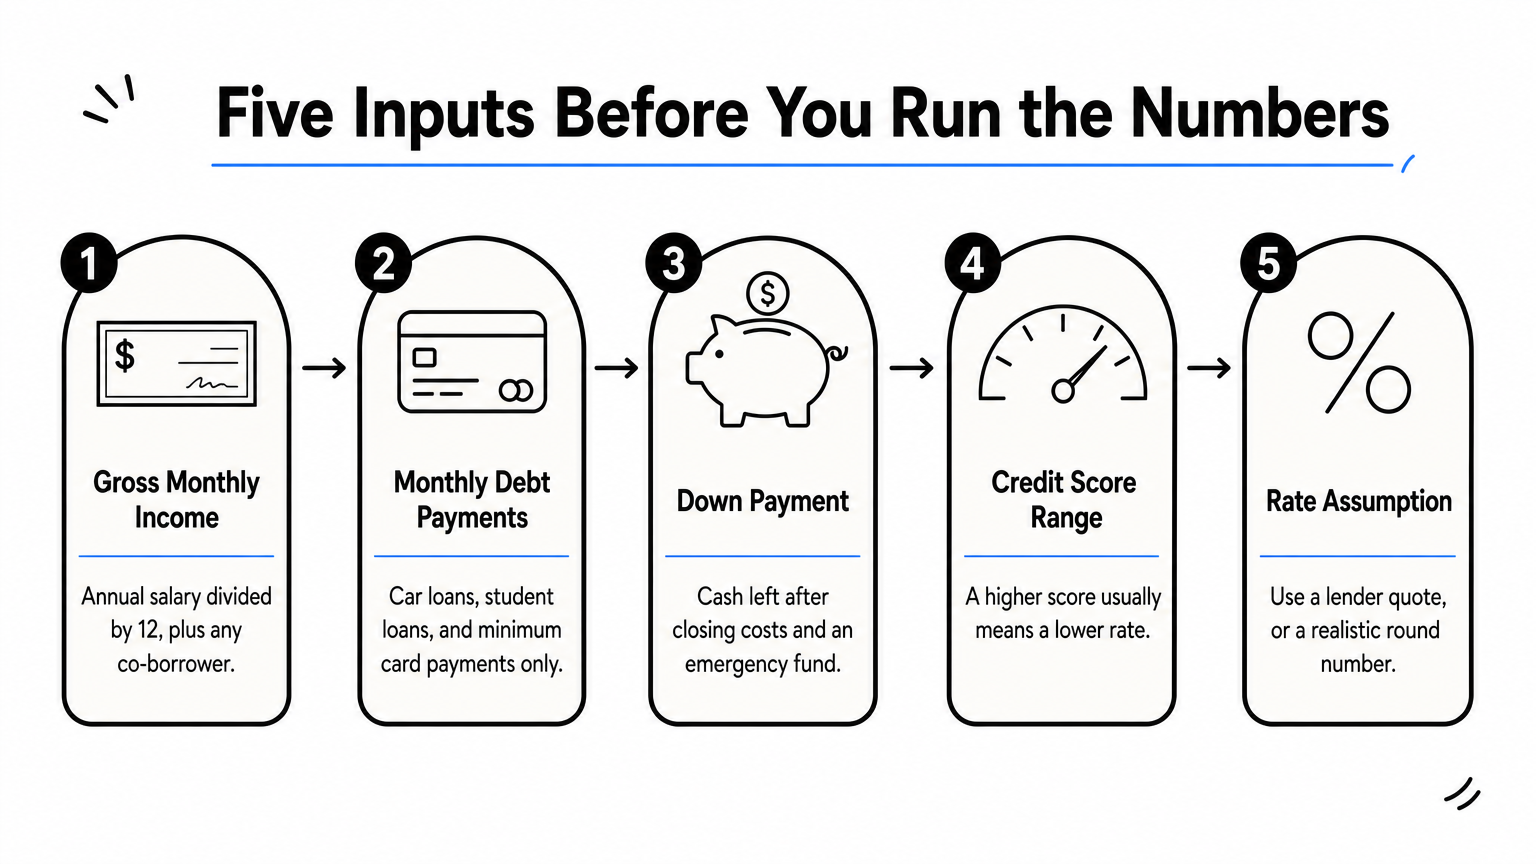
- Gross monthly income. Annual salary divided by 12. With a co-borrower, add both incomes together.
- Monthly debt payments. Include car loans, student loans, and the minimum on each credit card. Leave out utilities, groceries, and phone bills, since lenders do not count them.
- Down payment. Count only cash you can spare after closing costs and an emergency fund.
- Credit score range. A higher credit score usually earns a lower rate and cheaper PMI.
- Rate assumption. Use a quote from a lender if you have one. Otherwise pick a realistic round number. This guide uses 6.5% on a 30-year fixed loan for illustration.
Decide how much to put down
Putting 20% down avoids private mortgage insurance on most conventional loans, which lowers your monthly payment and raises the price you can afford. Smaller down payments are common and often make sense, but expect PMI to be part of the payment. On a $333,000 home, 20% down is $66,600.
If you are unsure, compare 5%, 10%, 15%, and 20% side by side in the Down Payment Calculator before moving on. Your down payment changes the loan amount, so settle it first.
Step 2. Run the 28/36 rule by hand
To run the rule by hand, take 28% and 36% of your gross monthly income, subtract your debts from the 36% figure, and use the smaller result as your maximum housing payment. Then convert that payment into a price. Doing it once manually shows you which assumptions matter.
Find your two payment ceilings
Take a household earning $90,000 a year with $400 in monthly debts:
- Gross monthly income: $90,000 ÷ 12 = $7,500
- 28% housing ceiling: $7,500 × 0.28 = $2,100
- 36% total-debt ceiling: $7,500 × 0.36 = $2,700, minus $400 in debts = $2,300 for housing
- The smaller number wins, so the maximum housing payment is $2,100
Debts only change the answer once they pass 8% of your income, which is $600 a month at this salary. Below that, the 28% cap decides everything.
Convert the payment into a home price
Your payment covers more than the loan, so the conversion needs assumptions. At 6.5% over 30 years, every $1,000 borrowed costs about $6.32 a month in principal and interest. This guide also assumes 20% down and property taxes plus insurance of about 1.5% of the price per year. Together that means each dollar of home price costs about $0.0063 per month.
Divide your housing budget by 0.0063 to get a price. For $2,100, that gives roughly $333,000. Check it: the loan is $266,400, principal and interest are about $1,684, and taxes and insurance add about $416. The total is $2,100.
Divide your monthly housing budget by 0.0063 for a quick price estimate, assuming 20% down and a 6.5% rate.
See how income changes the answer
This table applies the same assumptions to common incomes, with no other debts:
| Annual income | Gross monthly | Max housing payment (28%) | Estimated home price |
|---|---|---|---|
| $50,000 | $4,167 | $1,167 | $185,000 |
| $60,000 | $5,000 | $1,400 | $222,000 |
| $70,000 | $5,833 | $1,633 | $259,000 |
| $90,000 | $7,500 | $2,100 | $333,000 |
| $100,000 | $8,333 | $2,333 | $370,000 |
| $135,000 | $11,250 | $3,150 | $499,500 |
| $200,000 | $16,667 | $4,667 | $740,000 |
These figures answer the questions people ask most. A $300,000 house costs about $1,892 a month here, which is 45% of a $50,000 salary and 32% of a $70,000 salary. It is out of reach at $50,000 and a stretch at $70,000 unless you put down more. To afford a $400,000 house, you need an income near $108,000.
Step 3. Check your number in the Affordability Calculator
The Affordability Calculator replaces the hand math with live results. Enter your income, monthly debt, down payment, and credit score, and it shows a conservative, moderate, and maximum scenario. It is free, needs no signup, and updates as you type.
Enter your numbers
Use the same five inputs from Step 1. Type your gross income before taxes, add the total of your monthly debt payments, then set your down payment and credit score. The calculator models fixed-rate loans using the standard amortization formula lenders use.
Each scenario shows an estimated maximum home price, a maximum monthly payment, and your resulting debt-to-income ratio. Your hand result should land close to the moderate scenario. A gap usually comes from different assumptions about rate, taxes, or insurance, so change those fields until you see why.
Pick the right scenario
The three scenarios cap housing at about 22%, 28%, and 33% of gross income, and all three respect a total debt limit near 36%. Here is how they compare for the $90,000 example with $400 in debts, using this guide's assumptions:
| Scenario | Share of income | Housing payment | Estimated price |
|---|---|---|---|
| Conservative | 22% | $1,650 | $262,000 |
| Moderate | 28% | $2,100 | $333,000 |
| Maximum | 33%, capped at $2,300 by the 36% limit | $2,300 | $365,000 |
Choose conservative if your income varies, you expect a baby or a career change, or your savings are thin. Moderate fits most steady-income buyers. Treat maximum as a ceiling you only approach with low debt, rising income, and solid reserves.
If you stretch to the maximum scenario, plan for it to leave you little room for anything else.
Step 4. Add the costs the formula misses
A monthly payment formula leaves out cash you need at closing and money you spend every year just owning the house. Subtract those from your budget before you commit, and most buyers end up choosing a price below the calculator's moderate figure.
Budget for one-time and ongoing costs
Using the $333,000 example with a $266,400 loan, plan for these:
- Closing costs: typically 2% to 5% of the loan amount, or $5,328 to $13,320. The Closing Cost Calculator breaks the total into origination, appraisal, title, inspection, and other fees.
- Maintenance: a common starting guideline is 0.5% of the home's value per year, which is about $1,665 a year or $139 a month. Older homes need more.
- Utilities and upkeep: electric, water, lawn care, and similar bills usually rise compared with renting.
- Cash reserves: keep about three months of housing payments after closing, which is $6,300 here.
Add the down payment, closing costs, and reserves, and this buyer needs roughly $78,000 to $86,000 in cash. Check that your savings cover it before you shop at $333,000.
Stress-test the rate and your cushion
Rates move your price faster than most buyers expect. At 7.5% instead of 6.5%, the same $266,400 loan costs about $1,863 a month in principal and interest, up from $1,684. To keep the total payment at $2,100, the affordable price drops to about $307,000, a loss of roughly $26,000 from one percentage point.
Run your estimate at your expected rate and again one point higher. If the higher-rate price still works, you have a cushion. Then ask whether the payment leaves room to keep saving for retirement and emergencies. If it does not, go lower.
These figures are planning estimates, not quotes. Your lender sets the final rate, and local assessors and insurers set taxes and premiums. A preapproval turns your estimate into a firm number.
Set your range, then verify it
Your affordable price comes from two ceilings: housing at 28% of gross income, and total debt at 36%. Gather your inputs, run the rule by hand, confirm it in a calculator, then lower the figure for closing costs, upkeep, and a rate cushion. Most buyers end up between the conservative and moderate scenarios.
Do the math once with your real numbers, and write down both your comfortable price and your absolute maximum. Then shop inside the comfortable range and keep the maximum as your limit in a bidding situation. When you are ready to see your own range, run your numbers in the free Affordability Calculator and compare the three scenarios against your budget.
This article is for general information and is not financial advice. Confirm figures with your lender or an official source before you decide.
Run your own numbers
Use our free calculators to see what this means for your loan.
More articles
- Amortization Schedule for a Mortgage with a Balloon Payment
- How to Use a Mortgage Calculator to Estimate Your Payment
- Mortgage Paid Off Calculator: How to Find Your Payoff Date
- Oklahoma Mortgage Calculator: Add Taxes, Insurance and PMI
- Amortization Schedule Payment Calculator: How to Use It
- How to Use an Amortisation Calculator and Read the Schedule
- Insurance and Mortgage: How PMI Works and What It Costs
- Extra Mortgage Payments: How They Work and What You Save
- How Much House Can I Afford with a $100K Salary?
- Mortgage Refinance Calculator: How to Find Your Break-Even